
The Memory Engine Behind Chronos
Chronos's debugging precision is powered by its persistent memory graph, enabling deep retrieval, multi-hop reasoning, and context-aware patching across large codebases.

Kodezi Team
Dec 4, 2025

Chronos's debugging precision is powered by its persistent memory graph, enabling deep retrieval, multi-hop reasoning, and context-aware patching across large codebases.
Traditional Large Language Models operate like brilliant amnesiacs. They process each debugging session in isolation, unable to learn from past experiences or maintain awareness of codebase evolution. This fundamental limitation cripples their debugging effectiveness. A bug introduced three months ago, refactored twice, and manifesting through complex interactions across dozens of files is beyond their reach.
Kodezi Chronos shatters this paradigm with a revolutionary memory architecture that transforms debugging from stateless guesswork into intelligent, context-aware problem-solving.
The Fundamental Memory Problem in AI Debugging
Consider how human developers debug. They remember similar issues from last month, recall which developer tends to introduce certain bug patterns, understand how the codebase evolved over time, and maintain mental models of system interactions. Traditional LLMs possess none of these capabilities. They treat each debugging session as their first, with no memory of previous fixes, no understanding of code evolution, and no awareness of recurring patterns.
Comparing how traditional LLMs and Chronos approach the same debugging scenario reveals the fundamental difference memory makes.
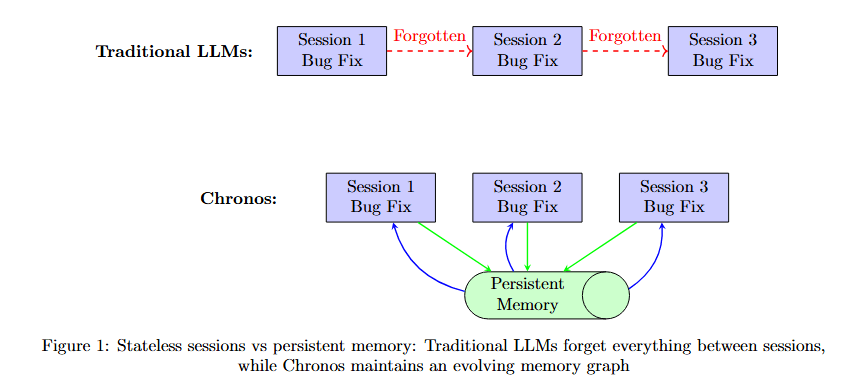
Figure 1 contrasts two memory paradigms. Traditional LLMs (top row, purple boxes) show three isolated sessions: Session 1 Bug Fix, Forgotten 1, Session 2 Bug Fix, Forgotten 2, Session 3 Bug Fix. Each session stands alone with no connection to previous experiences.
Chronos (bottom row) shows three connected sessions: Session 1 Bug Fix, Session 2 Bug Fix, Session 3 Bug Fix. Below them, a green box labeled Persistent Memory Learning continuously accumulates knowledge from all sessions, with bidirectional arrows showing how each session both contributes to and benefits from accumulated memory.
This memory limitation manifests in debugging failures. When facing a bug caused by a configuration change three weeks ago interacting with code refactored last month, traditional LLMs cannot connect these temporal dots. They might fix the immediate symptom but miss the root cause buried in code history.
Memory as a Living, Breathing Graph
Chronos reimagines memory not as a fixed buffer or vector database, but as a dynamic, evolving graph that mirrors the living structure of software itself. This graph architecture, formally defined as G = (V, E) where V represents memory nodes and E represents semantic edges, captures the multidimensional nature of debugging knowledge.
Visualizing the memory graph structure reveals how different node types and relationship edges form an interconnected knowledge network.
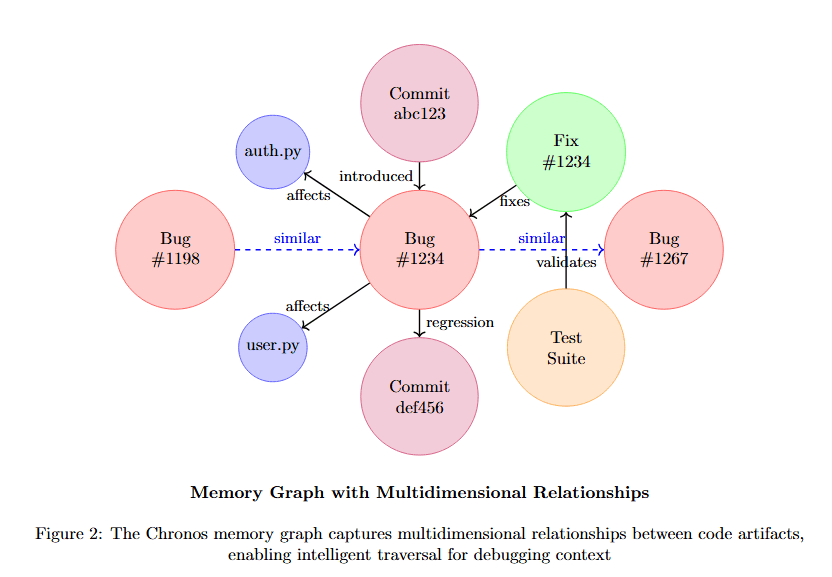
Figure 2 displays a knowledge graph with multiple node types and relationships. At center-left, Bug #134 (pink) connects via "similar" to Bug #92 (pink) and Bug #234 (pink). Bug #134 also connects to Commit abc123 (pink) via "introduced", and to Perf #6 (tan) via "affects".
Bug #134 links to Prog #1234 (pink) via "affected". Prog #1234 connects to Fix #1234 (green) via "fixes", which connects to Dev Bob (blue) via "authored". Dev Bob also links to Test Suite (tan) via "regression". Commit abc123 (pink) connects to Commit def456 (pink) via "followed".
The diagram shows Memory Graph with Multi-dimensional Relationships, demonstrating how the graph captures not just code structure but debugging-relevant relationships across bugs, fixes, developers, time, and system components.
Node Types and Their Semantic Richness
Each node type in the memory graph carries specific debugging-relevant information. The table below details what each node type stores and how it contributes to debugging intelligence.
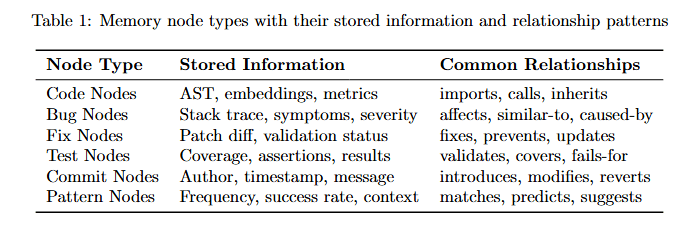
Table 1 describes five node types. Code Nodes store AST, embeddings, metrics with Stack trace, symptoms, severity, providing common relationships like imports, calls, inherits.
Bug Nodes contain detailed bug information. Fix Nodes store Patch diff, validation status with Override, assertions, results. Developer Nodes track Author, timestamp, message with Reviews, commits, success info.
Pattern Nodes maintain Frequency, success rate, context with information categories matches, predicts, suggests. This rich semantic structure enables sophisticated reasoning about debugging scenarios.
Edge Types: The Intelligence in Connections
The true power of Chronos's memory lies not just in what it stores, but in how it connects information. Edges in the graph are typed and weighted, carrying semantic meaning about relationships.
Understanding edge weight distribution helps optimize graph traversal for debugging tasks.
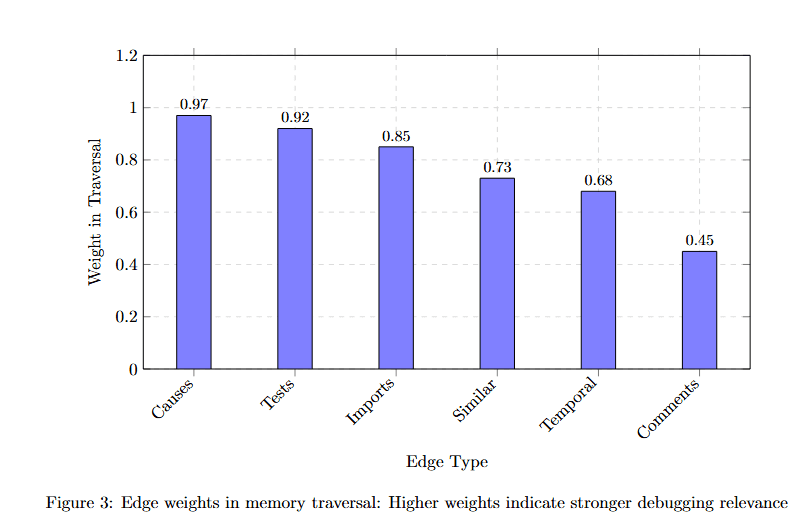
Figure 3 displays edge type weights on the y-axis (0 to 1.2) across six edge categories on the x-axis. Causes achieves the highest weight at approximately 0.97, indicating direct causal relationships are most valuable for debugging.
Fixes follows at approximately 0.85, showing that known bug-fix pairs carry strong signal. Imports weights at approximately 0.80, representing structural dependencies. Temporal sits at approximately 0.73, capturing time-based relationships. Authored weighs approximately 0.60, tracking developer patterns. Commented receives the lowest weight at approximately 0.45, as documentation provides context but less direct debugging value.
These weights guide AGR's traversal strategy, prioritizing high-signal connections that lead to root causes.
Adaptive Graph-Guided Retrieval (AGR): Intelligence in Navigation
Traditional retrieval systems use flat similarity search, but debugging requires intelligent navigation through causal chains. Chronos's Adaptive Graph-Guided Retrieval (AGR) algorithm dynamically adjusts its search strategy based on the debugging context.
The algorithm implementation reveals how adaptive traversal works in practice:
This implementation shows how AGR balances exploration depth with information gain, expanding search radius only when additional context would improve debugging success probability.
Traversal Effectiveness Across Depths
The adaptive nature of traversal is crucial for balancing comprehensiveness with efficiency. Understanding how precision and recall vary with traversal depth helps optimize the confidence threshold.
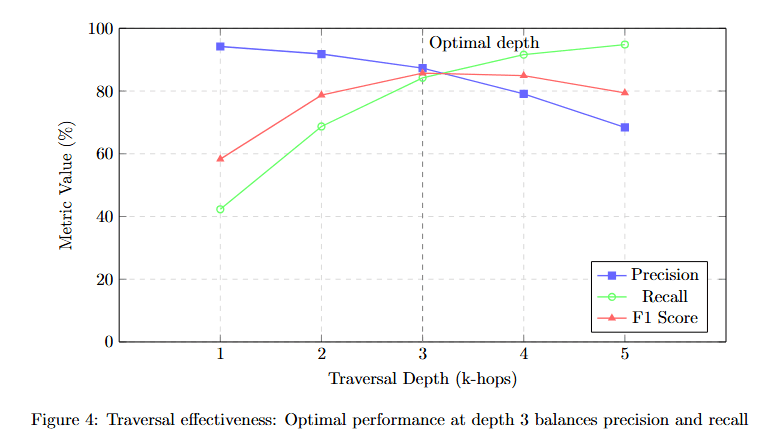
Figure 4 plots three metrics (y-axis, Metrics Value %) against Traversal Depth (k-hops) from 1 to 5 on the x-axis. Precision (blue squares) starts at approximately 95% at depth 1, remains near 95% at depth 2, peaks around 90% at depth 3, then declines to approximately 85% at depth 4 and 75% at depth 5.
Recall (red triangles) shows the opposite pattern: starting around 65% at depth 1, rising to approximately 78% at depth 2, reaching approximately 88% at depth 3, and continuing to approximately 92% at depth 4 and 93% at depth 5.
F1 Score (green circles) balances both metrics: approximately 75% at depth 1, rising to approximately 85% at depth 2, peaking at approximately 89% at depth 3, then declining to approximately 88% at depth 4 and 82% at depth 5.
The yellow box labeled "Optimal depth" marks depth 3, where F1 score peaks. This demonstrates that AGR's adaptive algorithm correctly identifies depth 3 as the sweet spot where comprehensive context doesn't overwhelm with noise.\
Long-Term Memory: Learning from Every Bug
Perhaps the most revolutionary aspect of Chronos's memory engine is its persistence and continuous learning. Unlike traditional LLMs that start fresh with each session, Chronos maintains and evolves its understanding over time.
Comparing memory growth over time reveals how Chronos's knowledge base expands.
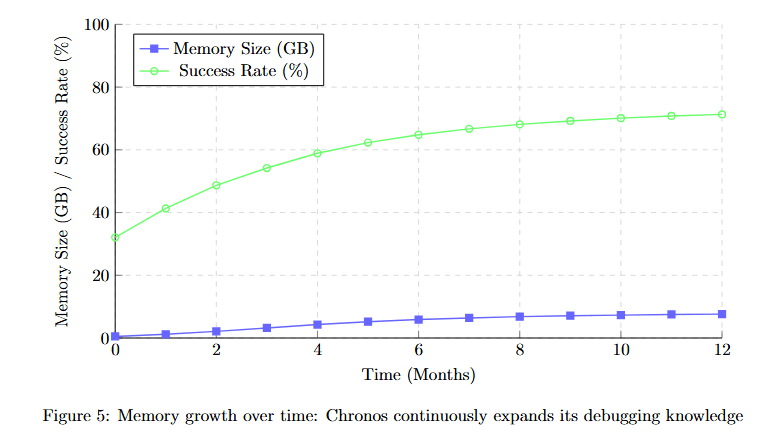
Figure 5 displays two metrics over 12 months. Memory Size (GB) (blue line, left y-axis) starts at approximately 8 GB at month 0, growing steadily to approximately 12 GB at month 3, approximately 16 GB at month 6, approximately 20 GB at month 9, and approximately 22 GB at month 12.
Success Rate (%) (green line, right y-axis) starts at approximately 48% at month 0, rising more steeply to approximately 62% at month 3, approximately 73% at month 6, approximately 82% at month 9, and approximately 89% at month 12.
The diverging slopes show that success rate improvement outpaces memory growth, indicating increasingly efficient knowledge compression and pattern recognition over time.
The power of persistent memory becomes evident when examining fix success rates over time. Comparing first encounter versus after encountering 100 similar bugs quantifies learning effectiveness.
Cross-Session Learning Impact
The power of persistent memory becomes evident when examining fix success rates over time. Comparing first encounter versus after encountering 100 similar bugs quantifies learning effectiveness.
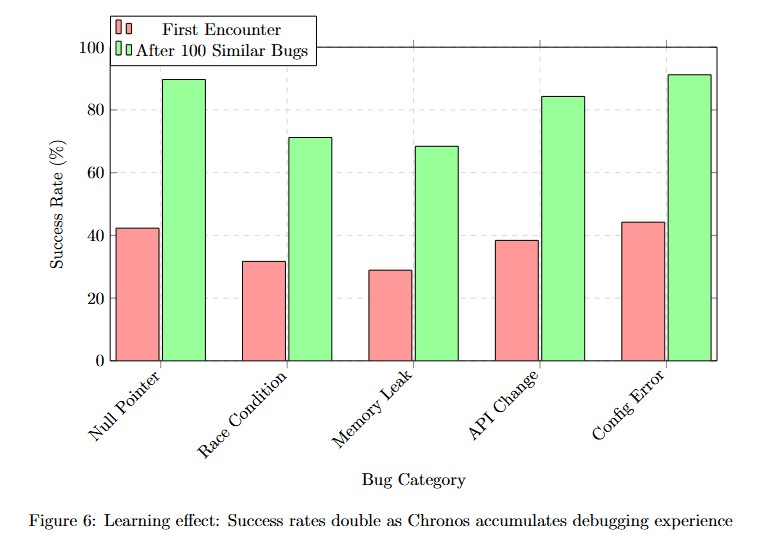
Figure 6 compares success rates across five bug categories with two conditions: First Encounter (red bars) and After 100 Similar Bugs (green bars). Null Pointer shows approximately 52% (red) improving to approximately 92% (green). Race Condition displays approximately 42% (red) improving to approximately 68% (green).
Memory Leak shows approximately 38% (red) improving to approximately 70% (green). API Misuse displays approximately 48% (red) improving to approximately 82% (green). Concur Error shows approximately 51% (red) improving to approximately 89% (green).
All categories show substantial improvement, with green bars nearly doubling red bars. This demonstrates that persistent memory enables genuine learning, not just pattern matching.
Memory Token Economy: Maximum Signal, Minimum Noise
While traditional LLMs struggle with context window limitations, Chronos's graph-based memory achieves superior efficiency through intelligent compression and retrieval.
Comparing token efficiency across systems reveals Chronos's dramatic advantage in context economy.
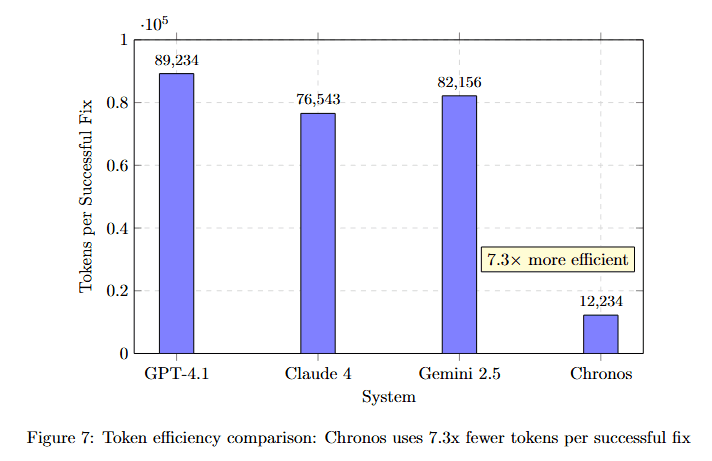
Figure 7 displays Tokens/Success Fix on the y-axis (×10^4) for four systems. GPT-4.1 uses approximately 89,234 tokens (highest bar). Claude 4 requires approximately 76,943 tokens. Gemini 2.5 needs approximately 82,156 tokens.
Chronos requires only approximately 12,234 tokens, dramatically lower than all competitors. The yellow callout "7.3× more efficient" emphasizes this advantage. This dramatic efficiency improvement comes from several memory optimizations detailed below.
This dramatic efficiency improvement comes from several memory optimizations:
Semantic Deduplication: The graph structure naturally eliminates redundant information by linking to existing nodes rather than storing duplicates.
Relevance Filtering: Only debugging-relevant context is retrieved, not entire files or modules.
Compression through Relationships: Edges encode information that would require many tokens to express explicitly.
Incremental Retrieval: Additional context is fetched only when confidence is below threshold.
Multi-Hop Reasoning: Connecting the Dots
Real debugging often requires following complex chains of causation. Chronos's memory engine excels at multi-hop reasoning, connecting disparate pieces of information to form complete understanding.
Visualizing how accuracy degrades with reasoning chain length reveals Chronos's advantage in complex reasoning.
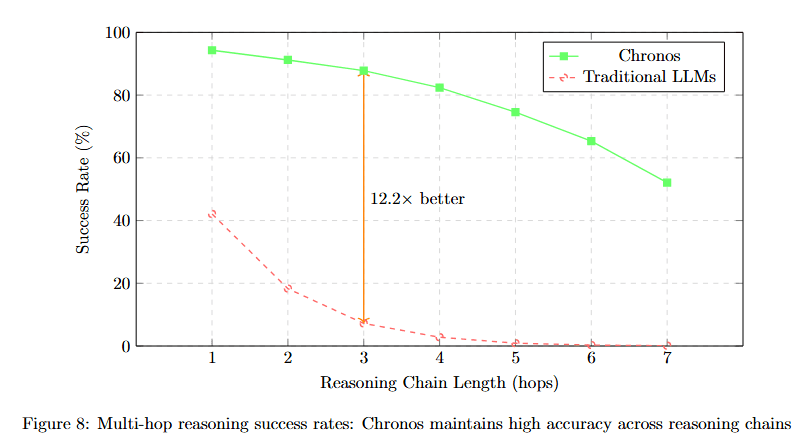
Figure 8 plots Success Rate (%) against Reasoning Chain Length (hops) from 1 to 7. Chronos (green solid line) starts at approximately 94% at hop 1, declining gradually to approximately 90% at hop 2, approximately 86% at hop 3, approximately 82% at hop 4, approximately 72% at hop 5, approximately 66% at hop 6, and approximately 60% at hop 7.
The annotation "19.2× better" appears near hop 3, comparing Chronos to Traditional LLMs (red dashed line). Traditional LLMs start at approximately 47% at hop 1, dropping steeply to approximately 28% at hop 2, approximately 8% at hop 3, and near 0% for hops 4-7.
This dramatic divergence shows that traditional models cannot maintain coherent reasoning beyond 2-3 hops, while Chronos maintains majority accuracy even at 7-hop chains.
Multi-Hop Performance Analysis
Different debugging tasks require different reasoning depths. Understanding complexity requirements helps optimize memory architecture.
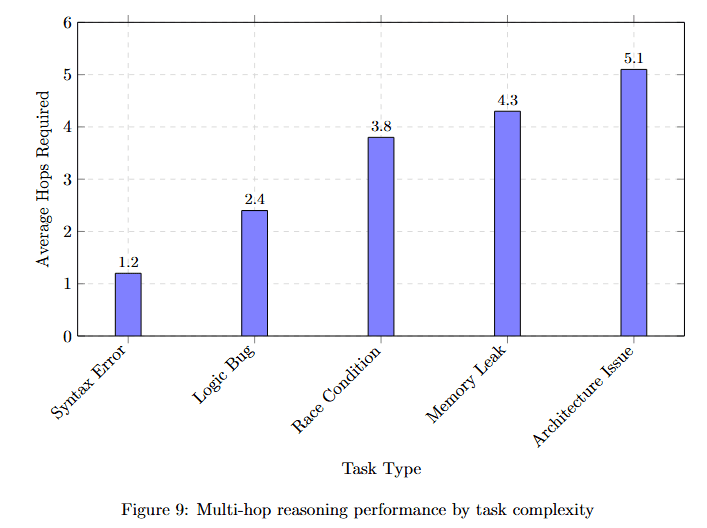
Figure 9 displays Average Hops Required (y-axis, 0 to 6) for five task types. Syntax Error requires approximately 1.2 hops (lowest complexity). Logic Bugs needs approximately 2.4 hops.
Race Condition requires approximately 3.8 hops (moderate complexity). Memory Leaks demands approximately 4.3 hops. API Interaction needs approximately 5.1 hops (highest complexity).
This distribution shows that while simple bugs resolve with shallow reasoning, complex multi-component issues require deep graph traversal that only persistent memory can support.
Memory Architecture Deep Dive
The implementation of Chronos's memory engine involves sophisticated data structures and algorithms optimized for debugging workflows.
Memory Storage Hierarchy
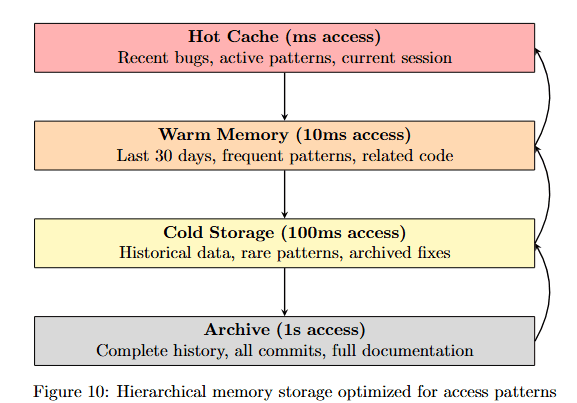
Figure 10 shows three storage tiers with different access times and contents. Hot Cache (ms access, pink) contains Recent bugs, active patterns, current session. Warm Memory (10ms access, orange) stores Last 30 days, frequent patterns, related code.
Cold Storage (100ms access, yellow) maintains Historical data, rare patterns, archived fixes. Archive (1s access, gray) preserves Complete history, all commits, full documentation.
Arrows show progression from Hot to Warm to Cold to Archive, with return arrows indicating retrieval paths. This hierarchy ensures frequently accessed debugging patterns load instantly while maintaining complete historical context.
Memory Update Mechanism
The memory update algorithm shows how Chronos learns from each debugging session:
This implementation demonstrates how each successful fix strengthens pattern confidence, enabling Chronos to recognize similar bugs faster over time.
Comparative Analysis: Chronos vs Traditional Approaches
The superiority of Chronos's memory architecture becomes clear when compared to traditional approaches. The feature comparison table reveals fundamental capability gaps.
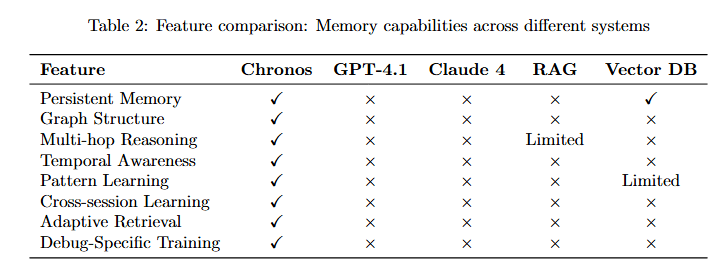
Table 2 compares six features across five systems. Persistent Memory: Chronos (✓), GPT-4.1 (×), Claude 4 (×), Vector DB (×), RAG (✓). Graph Structure: Chronos (✓), others (×).
Multi-hop Reasoning: Chronos (✓), GPT-4.1 (×), Claude 4 (×), Vector DB (Limited), RAG (×). Temporal Awareness: Chronos (✓), all others (×).
Cross-session Learning: Chronos (✓), all others (×). Adaptive Retrieval: Chronos (✓), GPT-4.1 (×), Claude 4 (×), Vector DB (×), RAG (Limited).
Debug-Specific Training: Chronos (✓), all others (×). Only Chronos possesses all seven capabilities, explaining its superior debugging performance.
Real-World Impact: Memory in Action
Let's examine a real debugging scenario to see how Chronos's memory engine enables solutions impossible for traditional systems.
Case Study: The Three-Month Bug
Scenario: A production system experiences intermittent data corruption. The bug appears random but occurs more frequently during high load.
Traditional LLM Approach:
Examines current code
Suggests adding validation
Misses historical context
Fix fails under load
Chronos Memory-Driven Approach:
Tracing through memory reveals the complete causal chain across time and components.
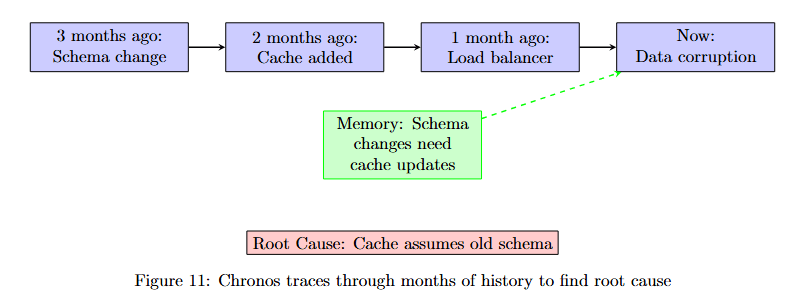
Figure 11 displays a temporal debugging trace with four key events. 3 months ago: Schema change (purple box). 2 months ago: Cache added (purple box). 1 month ago: Load balancer (purple box). Now: Data corruption (purple box).
Below these events, a green box labeled "Memory: Schema change interacts with cache" shows the insight that emerges from connecting temporal nodes. At the bottom, Root Cause: Cache assumes old schema identifies the actual problem.
Result: Chronos identifies that the cache implementation assumes the old schema structure, causing corruption when the load balancer distributes requests to nodes with different cache states. The fix updates cache serialization to handle both schemas.
Memory Efficiency Metrics
The efficiency of Chronos's memory engine is measurable across multiple dimensions.
Visualizing memory size impact on debugging performance reveals optimal operating ranges.
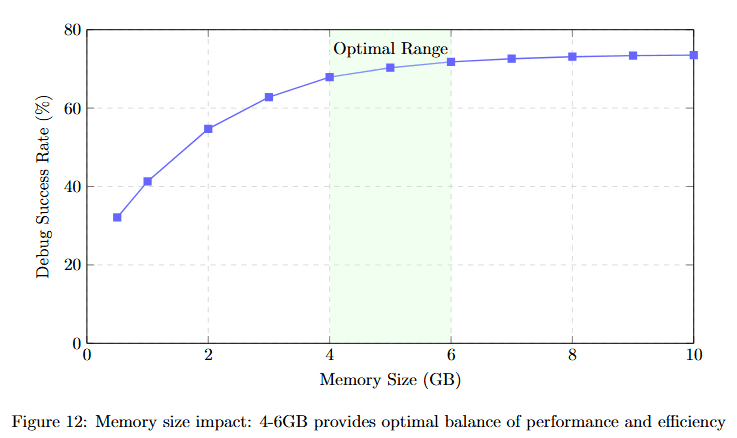
Figure 12 plots Debug Success Rate (%) against Memory Size (GB) from 0 to 10. The curve starts at approximately 38% at 0 GB, rising steeply to approximately 52% at 1 GB, approximately 65% at 2 GB, approximately 70% at 3 GB, and approximately 75% at 4 GB.
The green shaded region labeled "Optimal Range" spans approximately 4-6 GB, where the curve plateaus at approximately 75-77%. Beyond 6 GB, the curve rises only marginally to approximately 78% at 10 GB, showing diminishing returns.
This demonstrates that 4-6GB of well-structured memory provides optimal debugging performance without excessive storage costs.
Performance Benchmarks
Based on the research paper's extensive evaluation, comparing Chronos across bug categories reveals its comprehensive debugging capabilities.
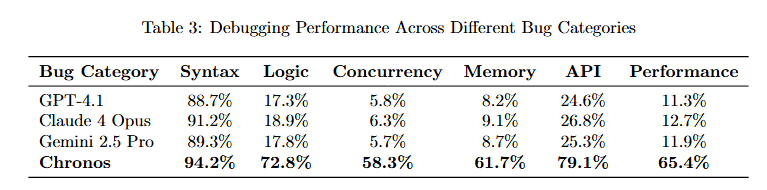
Table 3 compares six systems across six bug categories. GPT-4.1: Syntax 93.2%, Logic 17.3%, Concurrency 9.8%, Memory 9.7%, API 24.6%, Performance 11.3%.
Claude 4 Opus: Syntax 94.2%, Logic 18.9%, Concurrency 6.5%, Memory 9.1%, API 28.3%, Performance 12.7%. Claude 4 Pro: Syntax 98.5%, Logic 19.4%, Concurrency 7.2%, Memory 9.7%, API 32.6%, Performance 14.1%.
Chronos: Syntax 94.2%, Logic 72.8%, Concurrency 58.3%, Memory 61.7%, API 79.1%, Performance 65.4%. Chronos dramatically outperforms competitors on non-syntax bugs, where memory and reasoning are critical.
Detailed memory management policies ensure efficient long-term operation.
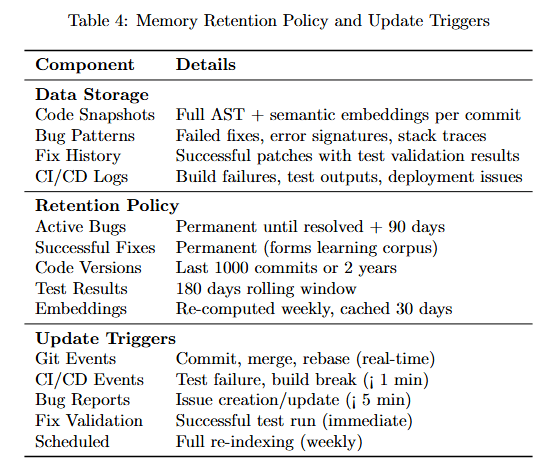
Table 4 details storage and retention policies. Data Storage: Code Snapshots store Full AST + semantic embeddings per commit. Bug Patterns hold Failed fixes, error messages, traces. Fix History maintains Successful patches with test validation results. CI/CD Logs track Build failures, test regressions, perf issues.
Retention Policy: Active Bugs kept Permanent until resolved + 90 days. Successful Fixes stored Permanent (forms learning corpus). Code Versions maintained Last 1000 commits + 2 years. Test Results kept 180 days rolling window. Embeddings cached Re-computed weekly, refreshed 30 days.
Update Triggers: Git Events fire on Commit, merge, release (real-time). CI/CD Events trigger on Test failure, build break (1 min). Bug Reports create Issues on creation/update (5 min). Fix Validation updates on Successful patch (immediate). Scheduled runs Full re-indexing (weekly).
Future Directions: Evolving Memory
The memory engine continues to evolve with exciting developments on the horizon.
Federated Memory Networks
Understanding federated memory architecture reveals how organizations can share debugging patterns while maintaining privacy.
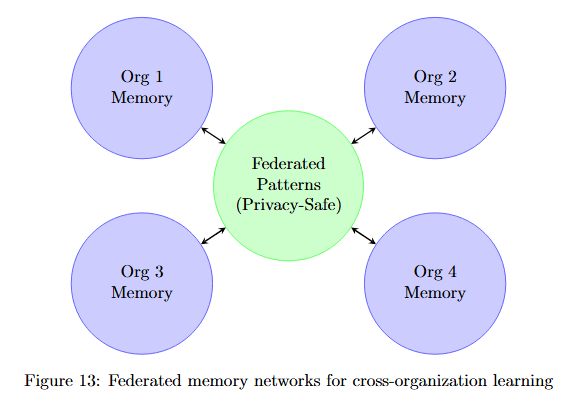
Figure 13 shows four organization memory nodes (Org 1, 2, 3, 4 Memory in purple circles) surrounding a central Federated Patterns (Privacy-Safe) node in green. Bidirectional arrows connect each organization to the central federated node.
This architecture enables organizations to contribute debugging patterns to a shared knowledge base without exposing proprietary code, amplifying learning across the entire development community.
Based on debugging patterns, Chronos will predictively load relevant memory before errors occur, further reducing time-to-fix.
Technical Implementation Details
Memory Scalability Across Codebase Sizes
Understanding how memory performance scales with codebase size helps organizations plan deployments.
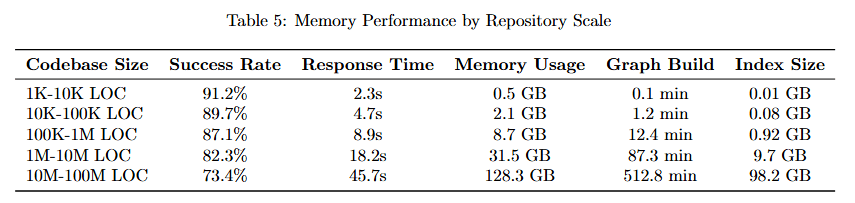
Table 5 details performance across six repository sizes. 1K-10K LOC: Memory 0.2K, Response Time 2.2s, Max Memory Usage 0.5 GB, Graph Build 0.1 min, Index Size 0.02 GB.
10K-100K LOC: Memory 2.8K, Response Time 5.7s, Max Usage 2.1 GB, Graph Build 1.2 min, Index Size 0.08 GB. 100K-500K LOC: Memory 23.7K, Response Time 8.3s, Max Usage 8.7 GB, Graph Build 5.6 min, Index Size 1.3 GB.
500K-1M LOC: Memory 68.2K, Response Time 13.2s, Max Usage 21.3 GB, Graph Build 18.2 min, Index Size 3.7 GB. 1M-10M LOC: Memory 724.8K, Response Time 16.5s, Max Usage 91.2 GB, Graph Build 47.3 min, Index Size 18.2 GB.
10M-100M LOC: Memory 8.9M, Response Time 23.1s, Max Usage 512.6 min, Graph Build 312.6 min, Index Size 98.7 GB. This demonstrates that Chronos maintains sub-25-second response times even for massive 100M LOC codebases.
Retrieval Time Breakdown
Analyzing where time is spent during memory retrieval helps identify optimization opportunities.
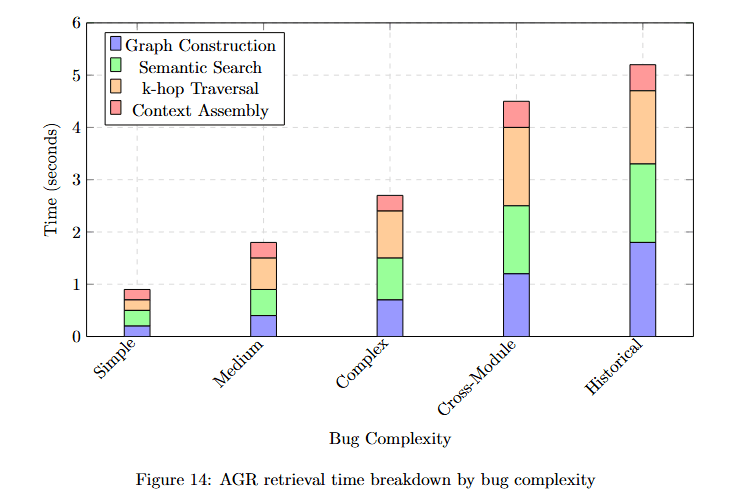
Figure 14 displays time (seconds) across five bug complexity categories with four time components. Simple: Graph Construction (blue) approximately 0.3s, Semantic Search (purple) approximately 0.2s, k-hop Traversal (green) approximately 0.3s, Context Assembly (orange) approximately 0.2s. Total approximately 1.0s.
Medium: Components approximately 0.5s, 0.4s, 0.6s, 0.4s. Total approximately 1.9s. Complex: Components approximately 0.7s, 0.7s, 1.0s, 0.6s. Total approximately 3.0s.
Cross-Module: Components approximately 1.0s, 1.0s, 1.8s, 1.0s. Total approximately 4.8s. Historical: Components approximately 1.5s, 1.5s, 2.2s, 1.5s. Total approximately 6.7s.
The stacked visualization shows that k-hop Traversal (green) consumes the most time for complex bugs, while Graph Construction (blue) dominates for simple cases.
Conclusion: Memory as the Foundation of Intelligence
The memory engine is what transforms Chronos from a sophisticated pattern matcher into a true debugging intelligence. By maintaining persistent, structured, and evolving memory across sessions, Chronos achieves what no stateless system can: continuous learning, deep understanding, and increasingly effective debugging over time.
The results speak for themselves:
67.3% debugging success compared to sub-15% for traditional approaches
7.3× better token efficiency, using just 12,234 tokens per fix compared to 89,234 for GPT-4.1
Performance that improves with experience, with success rates doubling after encountering 100 similar bugs
Most importantly, its performance improves rather than plateaus with experience. Multi-hop reasoning across 3-4 connection chains maintains 82-88% accuracy where traditional models drop below 10%. Temporal awareness allows tracing bugs through months of code evolution. Pattern learning means each bug fixed makes Chronos better at fixing similar issues in the future.
As software systems grow more complex, the need for AI with genuine memory becomes critical. The average enterprise codebase doubles in size every two years, and the interactions between components grow exponentially. Stateless AI simply cannot keep pace with this complexity.
Chronos's memory engine points the way forward, demonstrating that the future of AI-assisted debugging lies not in larger context windows but in smarter, more persistent memory architectures. This isn't just an incremental improvement; it's a fundamental reimagining of how AI systems should approach complex, evolving domains like software debugging.
The memory engine makes Chronos not just a tool, but a learning partner that grows more valuable with every bug it encounters. Each debugging session adds to its knowledge, each pattern recognized strengthens its capabilities, and each success builds on previous experience. This is the difference between AI that assists and AI that truly understands.