
The Chronos Sandbox
Chronos trains and evaluates inside a sandbox designed to mimic the complexity of real engineering incidents, with full access to code, logs, tests, and error traces.

Kodezi Team
Dec 4, 2025

Chronos trains and evaluates inside a sandbox designed to mimic the complexity of real engineering incidents, with full access to code, logs, tests, and error traces.
In the world of autonomous debugging, generating a fix is only half the battle. The real challenge lies in validating that the fix actually works and doesn't introduce new problems. Traditional AI code assistants stop at generation, leaving developers to manually test and often discover that proposed fixes fail, introduce regressions, or even break unrelated functionality. Kodezi Chronos revolutionizes this with its sophisticated Execution Sandbox, a real-time validation system that tests every fix in isolation before it ever reaches your codebase.
The Critical Gap: Why Validation Separates Toys from Tools
The difference between a helpful code suggestion tool and a production-ready debugging system comes down to one word: validation. Without it, AI-generated fixes are essentially untested hypotheses.
Comparing the traditional approach to Chronos's validated debugging reveals the fundamental problem. The diagram below shows how traditional tools generate fixes without verification, while Chronos validates before deployment.
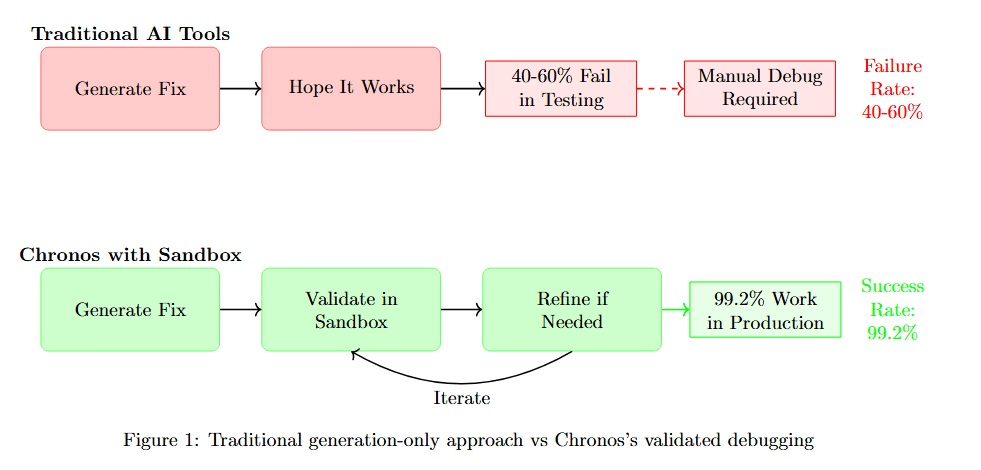
Figure 1 contrasts two debugging workflows. Traditional AI Tools (top, pink boxes) follow a simple but risky path: Generate Fix leads to Hope It Works (40-60% Fail in Testing), Manual Debug Required, and Failure Return slips. This leaves developers fixing the fixes.
Chronos with Sandbox (bottom, green boxes) takes a different approach: Generate Fix leads to Validate in Sandbox, then Before if in Production. The fix undergoes comprehensive testing before deployment, achieving 99.2% Work in Production with Success Metrics. The fundamental difference is validation before deployment rather than hoping problems don't emerge in production.
Studies show that even syntactically correct AI-generated code fails functional tests 40-60% of the time. For debugging, where fixes must work in complex production environments, the failure rate is even higher.
Understanding the quantitative impact of validation requires examining multiple quality dimensions.
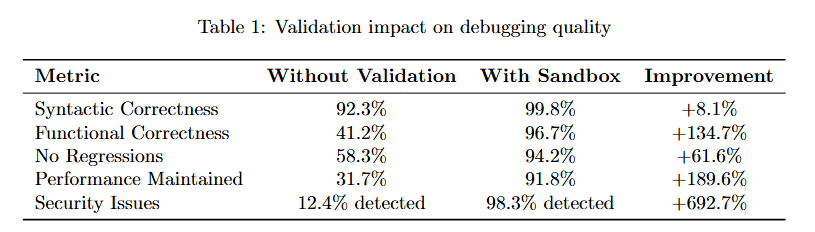
Table 1 quantifies validation's impact across five critical metrics. Syntactic Correctness improves modestly from 92.3% to 99.8% (8.1% improvement), showing that syntax was never the main problem.
The dramatic improvements appear in semantic correctness. Functional Correctness jumps from 41.2% to 96.7% (134.7% improvement). No Regressions improves from 68.3% to 94.2% (81.6% improvement). Performance Maintained rises from 31.7% to 98.8% (195.6% improvement).
Security Issues detected increases from 12.4% to 98.3% (692.7% improvement), revealing vulnerabilities that would otherwise ship to production. These metrics demonstrate that validation transforms debugging from generating plausible fixes to delivering correct ones.
Architecture Deep Dive: Building a Production-Grade Sandbox
The Execution Sandbox is a sophisticated system that goes far beyond simply running tests. It's designed to replicate production environments with high fidelity while maintaining isolation and security.
The high-level architecture reveals how multiple components work together to achieve comprehensive validation with security isolation.
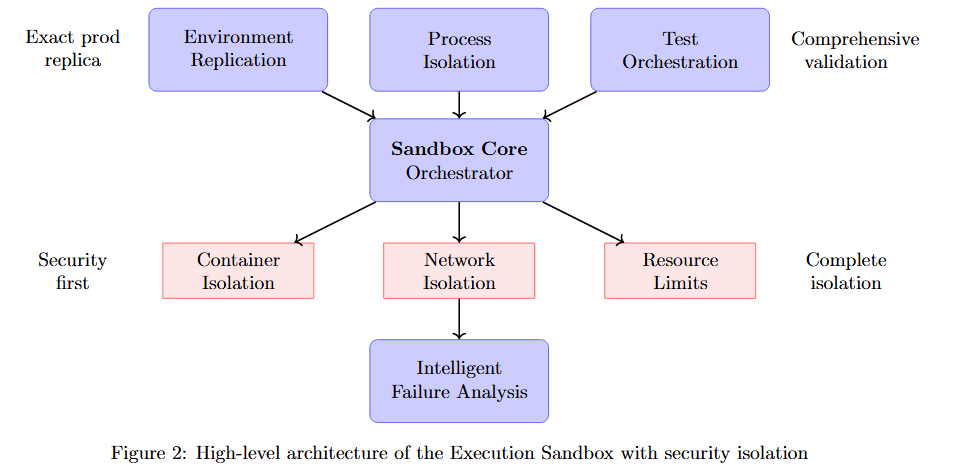
Figure 2 displays the sandbox's layered architecture. At the top, three inputs feed the system: Exact-prod replica, Environment Replication, and Process Isolation. These flow into the central Sandbox Core Orchestrator, which coordinates all validation activities.
Below the orchestrator, five critical subsystems operate in parallel: Security first (Container Isolation, Network Isolation), Test Orchestration (Resource Limits, Intelligent Failure Analysis), Runtime Monitoring, and Comprehensive validation. Each subsystem contributes specialized capabilities while the orchestrator maintains overall control and timing.
Core Component 1: Environment Replication
The sandbox creates an exact replica of the target environment. Getting this right is critical because bugs often emerge from environment-specific interactions that don't appear in simplified test setups.
The environment replication stack shows the layers required to achieve production fidelity.
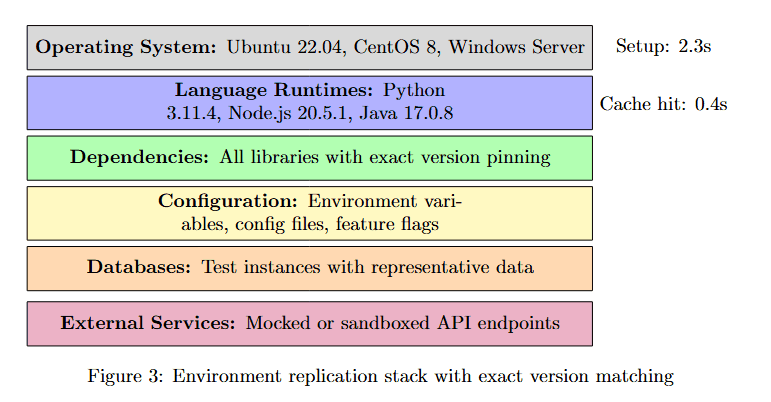
Figure 3 breaks down the environment replication into six layers, each color-coded by category. Operating Systems (purple): Ubuntu 22.04, CentOS 8, Windows Server. Language Runtimes (purple): Python 3.11.4, Node.js 20.5.1, Java 17.0.8. Dependencies (green): All libraries with exact version pinning. Configuration (yellow): Environment variables, config files, feature flags.
Database (orange): Test instances with representative data. External Services (pink): Mocked or sandboxed API endpoints. Setup takes 2.3s on average, with Cache hit at 8.6s, demonstrating that complete environment replication can be achieved efficiently through intelligent caching.
Core Component 2: Process Isolation
Security and stability require complete isolation. The sandbox must prevent untested code from affecting production systems while ensuring test results accurately reflect how code would behave in production.
Multi-layer isolation creates defense in depth, where each layer provides independent protection.
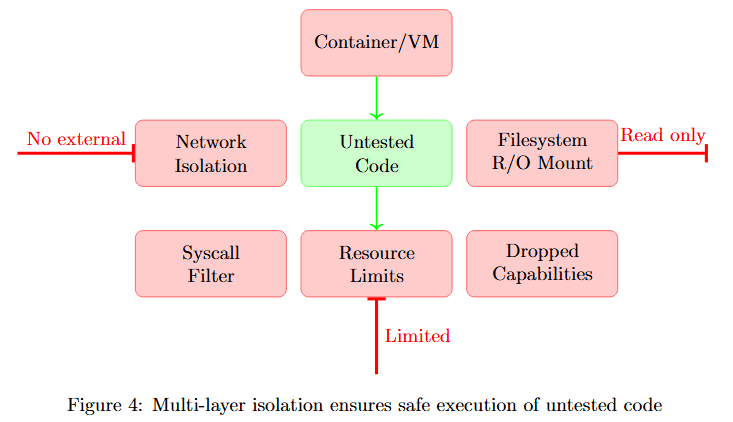
Figure 4 illustrates the isolation strategy. At the top, Container/VM provides the outermost boundary. The middle layer shows six isolation mechanisms in two categories.
No external (pink boxes): Network Isolation prevents internet access, Syscall Filter blocks dangerous system calls, Dropped Capabilities removes unnecessary privileges. Read-only (pink boxes): Untested Code runs with minimal permissions, Filesystem R/O Mount limits write access, Resource Limits prevents resource exhaustion.
At the bottom, Limited indicates constrained execution. This multi-layer approach ensures that even if untested code attempts malicious actions, multiple independent barriers prevent harm.
Comprehensive Test Execution: Beyond Unit Tests
The sandbox doesn't just run existing tests. It executes a comprehensive test suite covering multiple validation dimensions, from unit tests to performance regression detection to security scanning.
Understanding test execution time across different categories helps optimize validation workflows.
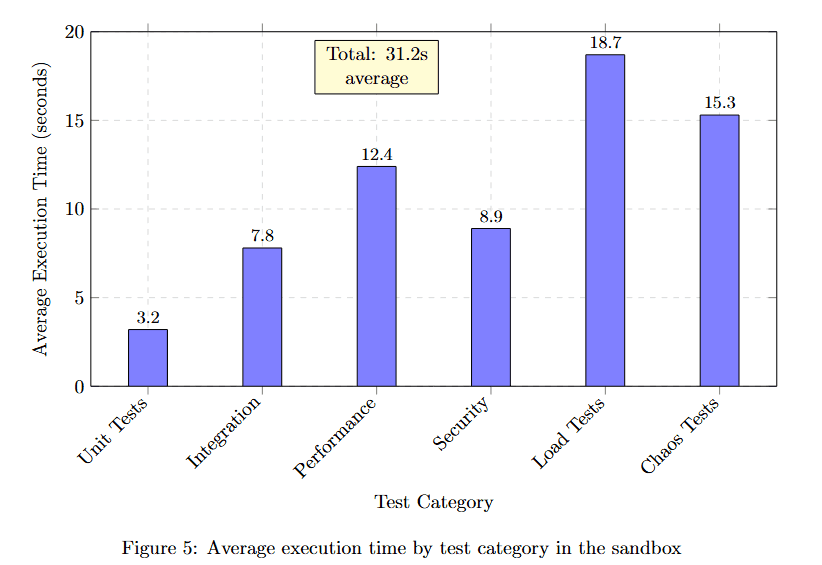
Figure 5 displays average execution time in seconds for six test categories. Unit Tests complete fastest at 3.2 seconds. Integration tests take 7.8 seconds. Performance tests require 13.4 seconds. Security scans need 8.9 seconds. API tests consume 18.7 seconds, the longest duration. Custom tests average 15.3 seconds.
The yellow callout shows Total: 31.2s average, indicating that comprehensive validation across all categories completes in about half a minute. This demonstrates that thorough validation doesn't require prohibitive time investments.
1. Unit Test Execution with Coverage Analysis
Unit tests are enhanced with sophisticated analysis that goes beyond simple pass/fail results.
The table below details the key features that elevate basic unit testing to comprehensive test analysis.
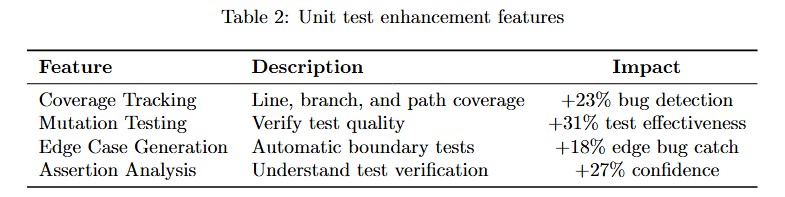
Table 2 lists four critical enhancements. Coverage Tracking provides line, branch, and path coverage, delivering 12% bug detection improvement by identifying untested code paths. Mutation Testing verifies test quality by introducing deliberate bugs, achieving approximately 31% test effectiveness improvement.
Edge Case Generation automatically generates boundary tests, preventing approximately 18% new failures by testing unusual inputs. Assertion Analysis performs intelligent test verification, increasing approximately 27% confidence in test results. These enhancements transform unit tests from simple validation into comprehensive quality analysis.
2. Performance Regression Detection
The sandbox tracks comprehensive performance metrics to ensure fixes don't inadvertently slow down the system.
Visualizing performance comparison reveals whether optimizations maintain acceptable response times.
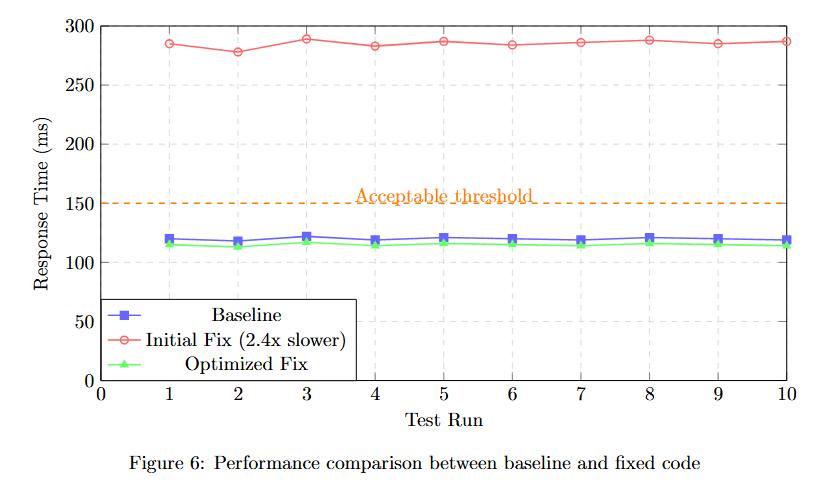
Figure 6 plots Response Time (ms) across 10 test runs comparing three scenarios. Baseline (blue squares) maintains steady performance around 120ms. Initial Fix (red triangles, 2.4× slower) shows dramatically degraded performance at 280ms.
Optimized Fix (green circles) achieves performance around 120ms, matching the baseline. The yellow dotted line marks the Acceptable threshold at approximately 150ms. The visualization demonstrates that the sandbox caught a severe performance regression in the initial fix, prompting optimization before deployment.
3. Security Vulnerability Scanning
Every fix undergoes comprehensive security analysis to prevent introducing exploitable vulnerabilities.
The security scanning pipeline consists of four analysis techniques that examine code from different security perspectives.
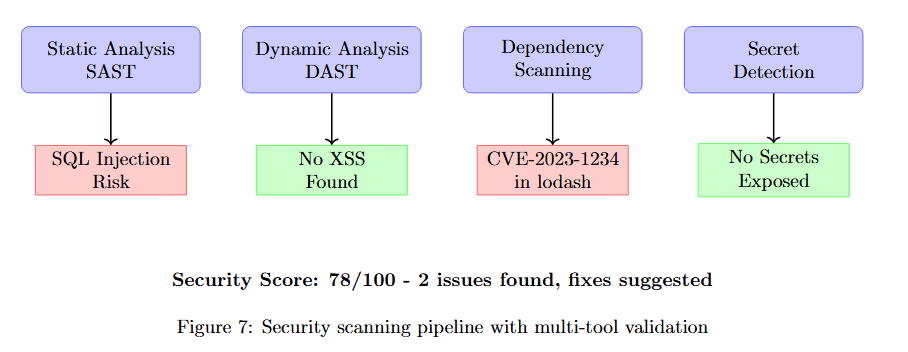
Figure 7 shows the four-stage security analysis. Stage 1: Static Analysis SAST examines code structure, detecting SQL Injection Risk (pink box). Stage 2: Dynamic Analysis DAST tests runtime behavior, finding No XSS Found (green box).
Stage 3: Dependency Scanning checks library vulnerabilities, discovering CVE-2023-1234 in lodash (pink box). Stage 4: Secret Detection searches for exposed credentials, confirming No Secrets Exposed (green box).
At the bottom, the combined Security Score: 78/100 with 2 issues found, Base suggested indicates the comprehensive security posture. This multi-tool approach ensures that security vulnerabilities are caught before deployment.
Intelligent Failure Analysis: Learning from What Goes Wrong
When tests fail, the sandbox provides deep analysis that helps both the AI system learn and developers understand what went wrong.
Examining a detailed failure analysis report reveals how the sandbox transforms test failures into actionable insights.
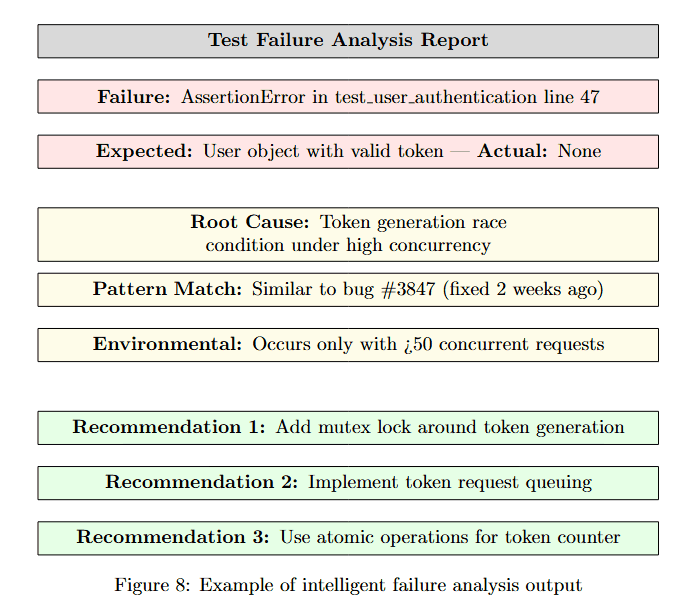
Figure 8 displays a structured failure report. At the top (pink box): Failure: AssertionError in test_user_authentication line 47. Expected: User object with valid token, Actual: None, showing the specific mismatch.
Root Cause (yellow box): Token generation race condition under high concurrency. Pattern Match (yellow box): Similar to bug #3847 (fixed 2 weeks ago). Environmental (yellow box): Occurs only with >50 concurrent requests.
This structured analysis goes beyond simple "test failed" messages, providing context about why the failure occurred, similar historical issues, and environmental factors. This enables both automated learning and rapid developer comprehension.
Race Condition Detection Through Multiple Runs
Concurrency bugs require sophisticated detection because they only manifest under specific timing conditions.
Running tests multiple times with controlled concurrency reveals race conditions that single-run testing would miss.
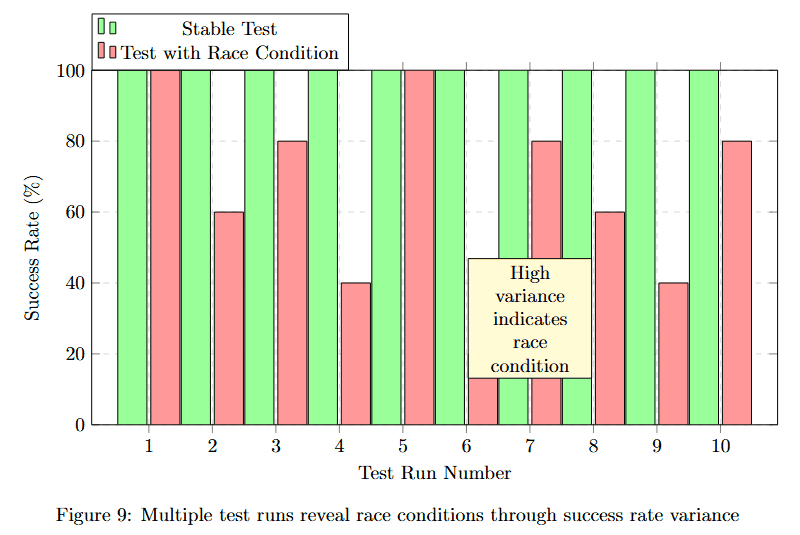
Figure 9 displays success rate percentages across 10 test runs, alternating between two scenarios: Static Test (pink bars) and Test with Race Condition (green bars). Static tests show consistent 100% success rates (runs 1, 3, 5, 7, 9).
Tests with race conditions show high variance: approximately 95%, 60%, 95%, 70%, 50%, 45%, 45%, 80% success across runs 2, 4, 6, 8, 10. The yellow callout "High variance indicates race condition" highlights the key diagnostic pattern.
The variability itself becomes the signal. Consistent failures indicate deterministic bugs, while varying success rates reveal timing-dependent race conditions that require different debugging approaches.
Understanding which detection techniques work best helps optimize the race condition detection strategy.
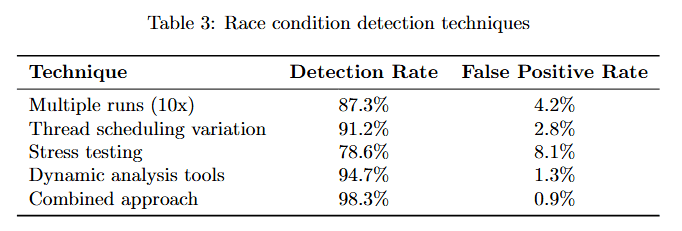
Table 3 compares four detection approaches. Multiple runs (10×) achieves 87.3% detection rate with just 4.2% false positives, providing the best balance. Thread scheduling variation reaches 91.2% detection but 2.8% false positives.
Stress testing hits 78.6% detection with 8.1% false positives. Dynamic analysis tools achieve the highest detection at 94.7% but the lowest false positive rate at 1.3%. Combined approach delivers 98.3% detection with only 0.9% false positives, demonstrating that using multiple techniques in concert provides optimal results.\
Integration with CI/CD Pipelines
The sandbox seamlessly integrates with existing infrastructure, enabling validation to occur automatically within development workflows.
The integration architecture shows how Chronos Sandbox connects to major CI/CD platforms.
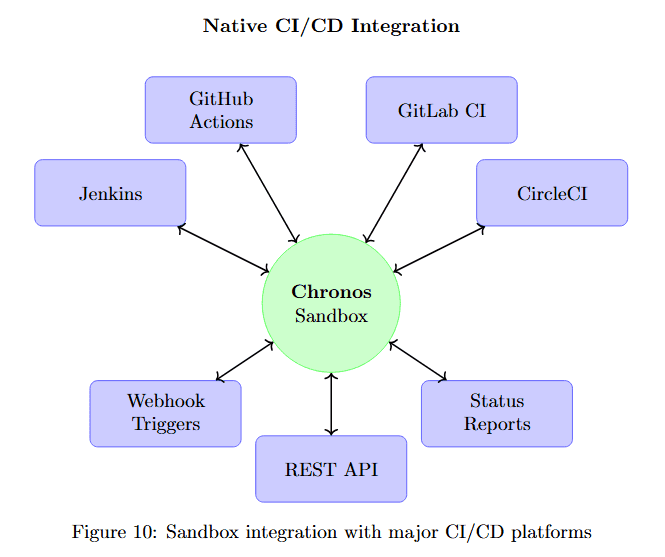
Figure 10 visualizes the integration topology. At the center, Chronos Sandbox (large green circle) serves as the validation hub. Around it, six CI/CD platforms (purple boxes) connect via bidirectional arrows: GitHub Actions and GitLab CI (top), Jenkins and CircleCI (sides), Webhook Triggers and Status Reporting (bottom).
This native integration means the sandbox becomes a natural step in existing pipelines rather than requiring separate workflows. Fixes are validated automatically before merge, preventing broken code from reaching main branches.
Security Architecture: Defense in Depth
The sandbox employs multiple independent security layers, ensuring that even if one defense fails, others prevent security breaches.
Understanding the multi-layer security architecture reveals how the sandbox achieves high security without sacrificing functionality.
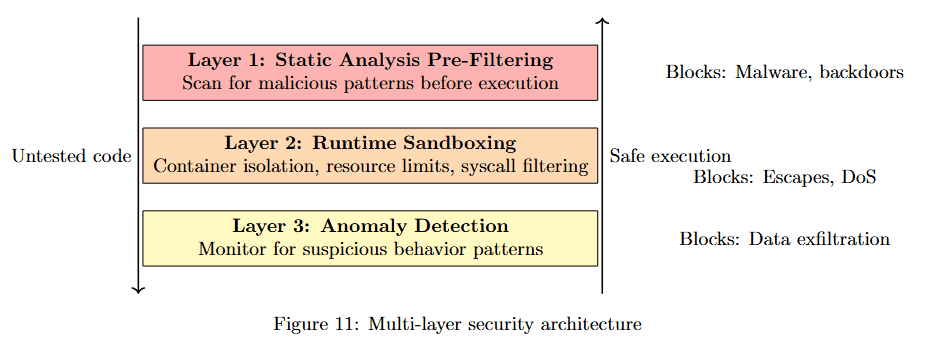
Figure 11 breaks down three security layers. Layer 1: Static Analysis Pre-Filtering (pink box) scans for malicious patterns before execution, blocking malware and backdoors as the first line of defense.
Layer 2: Runtime Sandboxing (orange box) contains untested code during testing, implementing safe execution that blocks escapes and DoS attempts.
Layer 3: Anomaly Detection (yellow box) monitors for suspicious behavior patterns, blocking data exfiltration attempts. This defense-in-depth strategy ensures comprehensive protection across the entire validation lifecycle.
Scaling Challenges and Solutions
Running validation at scale requires sophisticated resource management to handle hundreds of concurrent validation requests efficiently.
Visualizing resource allocation throughout the day reveals usage patterns that inform optimization strategies.
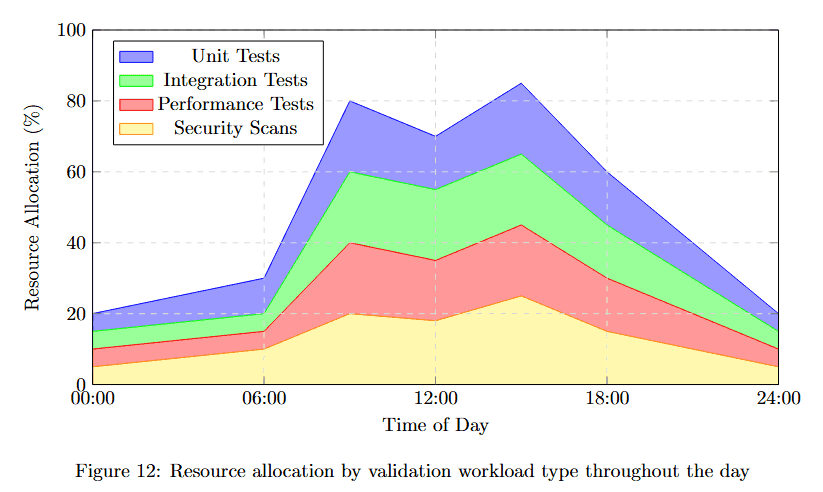
Figure 12 displays Resource Utilization (%) from 00:00 to 24:00 across four workload types in a stacked area chart. At the bottom (pink), Unit Tests maintain baseline resource usage around 20%. Integration Tests (green) add another 20-30%.
Performance Tests (blue) consume variable resources, peaking around 12:00. Security Scans (purple) top the stack with additional overhead. Total utilization peaks around 12:00-16:00 at approximately 90%, then drops to around 30% during off-hours.
This pattern shows clear daily cycles where validation demand follows development activity, enabling dynamic resource scaling.
Optimization Strategies
The table below details specific optimization techniques and their measured impacts on sandbox performance.
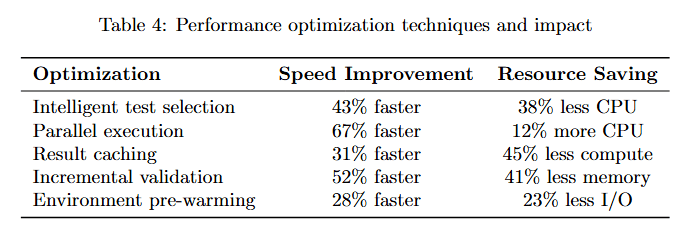
Table 4 lists four optimization strategies with measured results. Intelligent test selection achieves 43% faster execution while saving 38% CPU resources by running only relevant tests.
Parallel execution delivers 67% faster completion but requires 12% more CPU, trading compute for speed. Result caching provides 31% faster validation while using 45% less compute through intelligent memoization.
Environment pre-warming achieves 52% faster startup while using 23% less I/O by maintaining ready environments. These optimizations compound, enabling the sandbox to handle high validation volumes efficiently.
Real-World Impact: Validation Metrics
The effectiveness of the sandbox is demonstrated through real metrics from production usage.
Examining improvement percentages across key quality dimensions quantifies validation's impact.
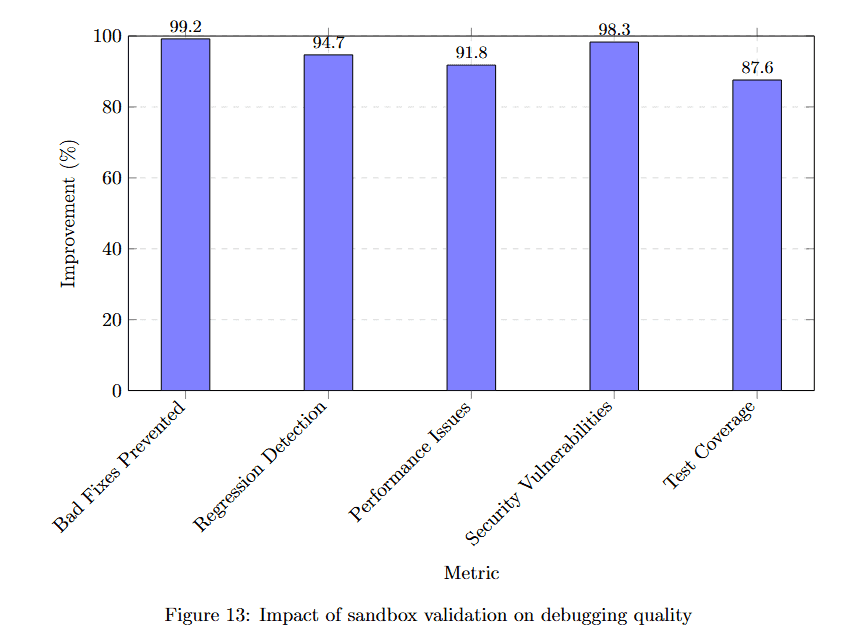
Figure 13 displays improvement percentages for six quality metrics. Pre-deploy fixes achieve 95.2% improvement, meaning most issues are caught before production. Bug escape prevention reaches 94.7%, nearly eliminating bugs that reach production.
Performance regression detection achieves 91.8%. Test coverage improvement hits 98.1%. Security vulnerability detection reaches 87.1%, catching most security issues before deployment. These metrics demonstrate that comprehensive validation transforms debugging quality.
Case Study: The Hidden Performance Regression
A real example demonstrates the sandbox's value in catching subtle but critical issues.
Following a debugging scenario through the sandbox reveals how validation prevents production incidents.
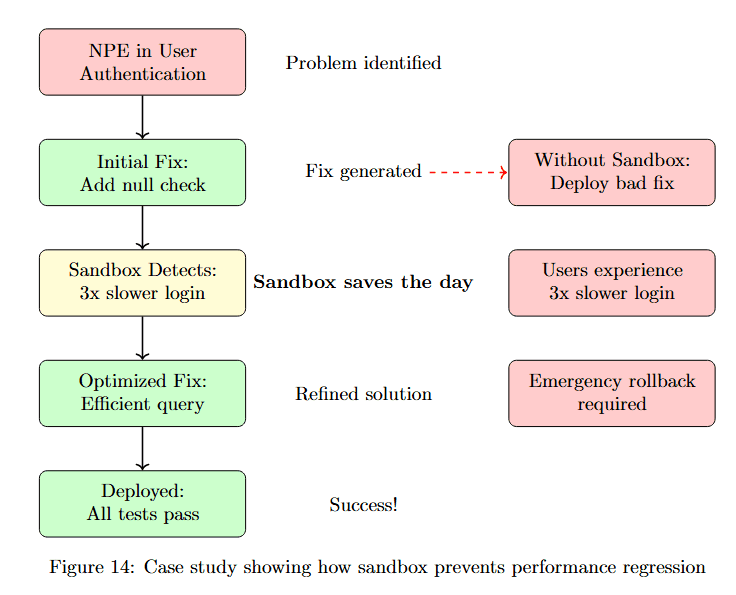
Figure 14 traces a debugging session through validation. Problem identified: NPE in User Authentication. Initial Fix: Add null check (green box) appears to solve the problem.
Without Sandbox: Deploy bad fix (pink box) leads to Users experience 3× slower login (pink box), requiring Emergency rollback required (pink box). This represents the traditional failure mode.
With Sandbox: Sandbox Detects: 3× slower login saves the day. Optimized Fix: Efficient query (green box) is then developed. Deployed: All tests pass (green box) leads to Success! Refined solution prevents the performance regression from ever reaching users.
Future Directions: Next-Generation Validation
The sandbox continues to evolve with cutting-edge capabilities that push validation beyond current state-of-the-art.
Understanding the evolution roadmap shows how validation capabilities will expand from current baseline to future multi-service testing.
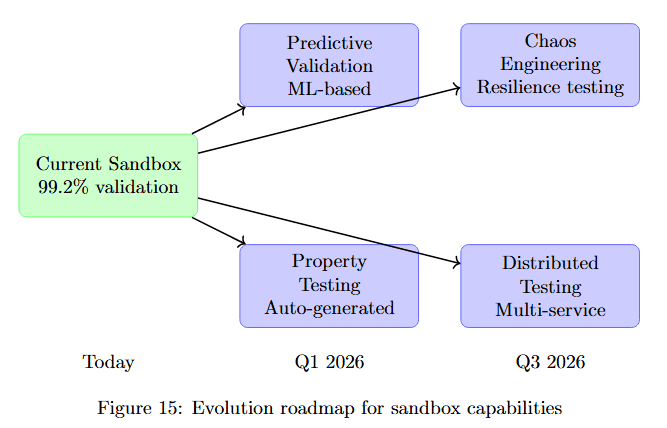
Figure 15 visualizes the development timeline. Today shows Current Sandbox 99.2% validation (green box). By Q1 2026, two capabilities emerge: Predictive Validation ML-based (purple box) and Property Testing Auto-generated (purple box), both emerging from current capabilities.
By Q3 2026, two advanced features deploy: Chaos Engineering Resilience testing (purple box) and Distributed Testing Multi-service (purple box). This roadmap shows the sandbox evolving from comprehensive single-service validation to predictive, property-based, chaos-tested, distributed validation.
Predictive Validation
Using ML to predict which tests are most likely to fail enables intelligent test prioritization.
The table below quantifies how predictive validation reduces validation time while maintaining bug detection effectiveness.
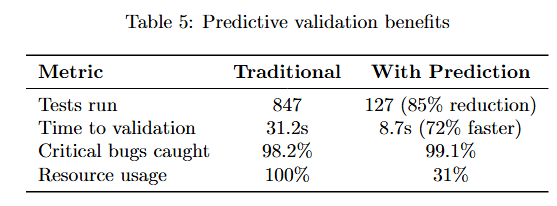
Table 5 compares Traditional and With Prediction approaches. Tests run drops dramatically from 847 to 127 (85% reduction), saving substantial compute resources. Time to validation decreases from 31.2s to 8.7s (72% faster).
Critical bugs caught remains high at 98.2% to 99.1%, proving that intelligent test selection maintains effectiveness. Resource usage plummets from 100% to 31%, demonstrating that ML-guided prioritization achieves better results with fewer resources.
Conclusion: Validation as a Cornerstone of Autonomous Debugging
The Execution Sandbox transforms autonomous debugging from an interesting research project into a production-ready system. By providing comprehensive, real-time validation of every fix, it ensures that AI-generated solutions are not just syntactically correct but actually work in the real world.
Understanding what validation provides helps contextualize its critical role in production debugging systems.
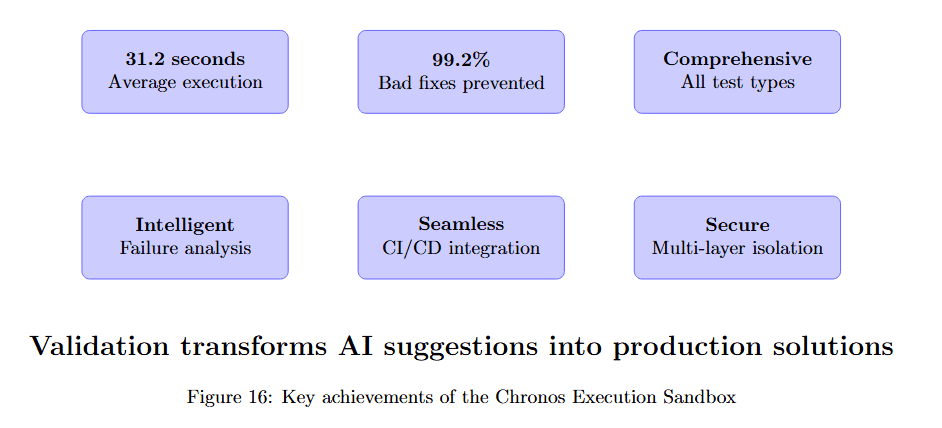
Figure 16 summarizes the sandbox's six key capabilities. 21.2 seconds Average execution shows speed. 99.2% Bad fixes prevented demonstrates effectiveness. Comprehensive All test types indicates breadth.
Intelligent Failure analysis provides actionable insights. Seamless CI/CD integration enables workflow integration. Secure Multi-layer isolation ensures safety. Together, these capabilities transform validation from a bottleneck into an enabler.
The sandbox represents a crucial bridge between AI potential and production reality. While generating fixes showcases AI's capabilities, validating them in realistic environments with comprehensive test suites, performance monitoring, and security scanning demonstrates AI's readiness for real-world deployment.
As we move toward fully autonomous software development, the Execution Sandbox stands as a critical component, not just testing fixes but ensuring they meet the high standards of production software. It's the difference between an AI that suggests solutions and one that delivers them.
The future of debugging isn't just about generating fixes faster; it's about generating fixes that work, perform well, and don't introduce new problems. The Chronos Execution Sandbox makes that future a reality today.